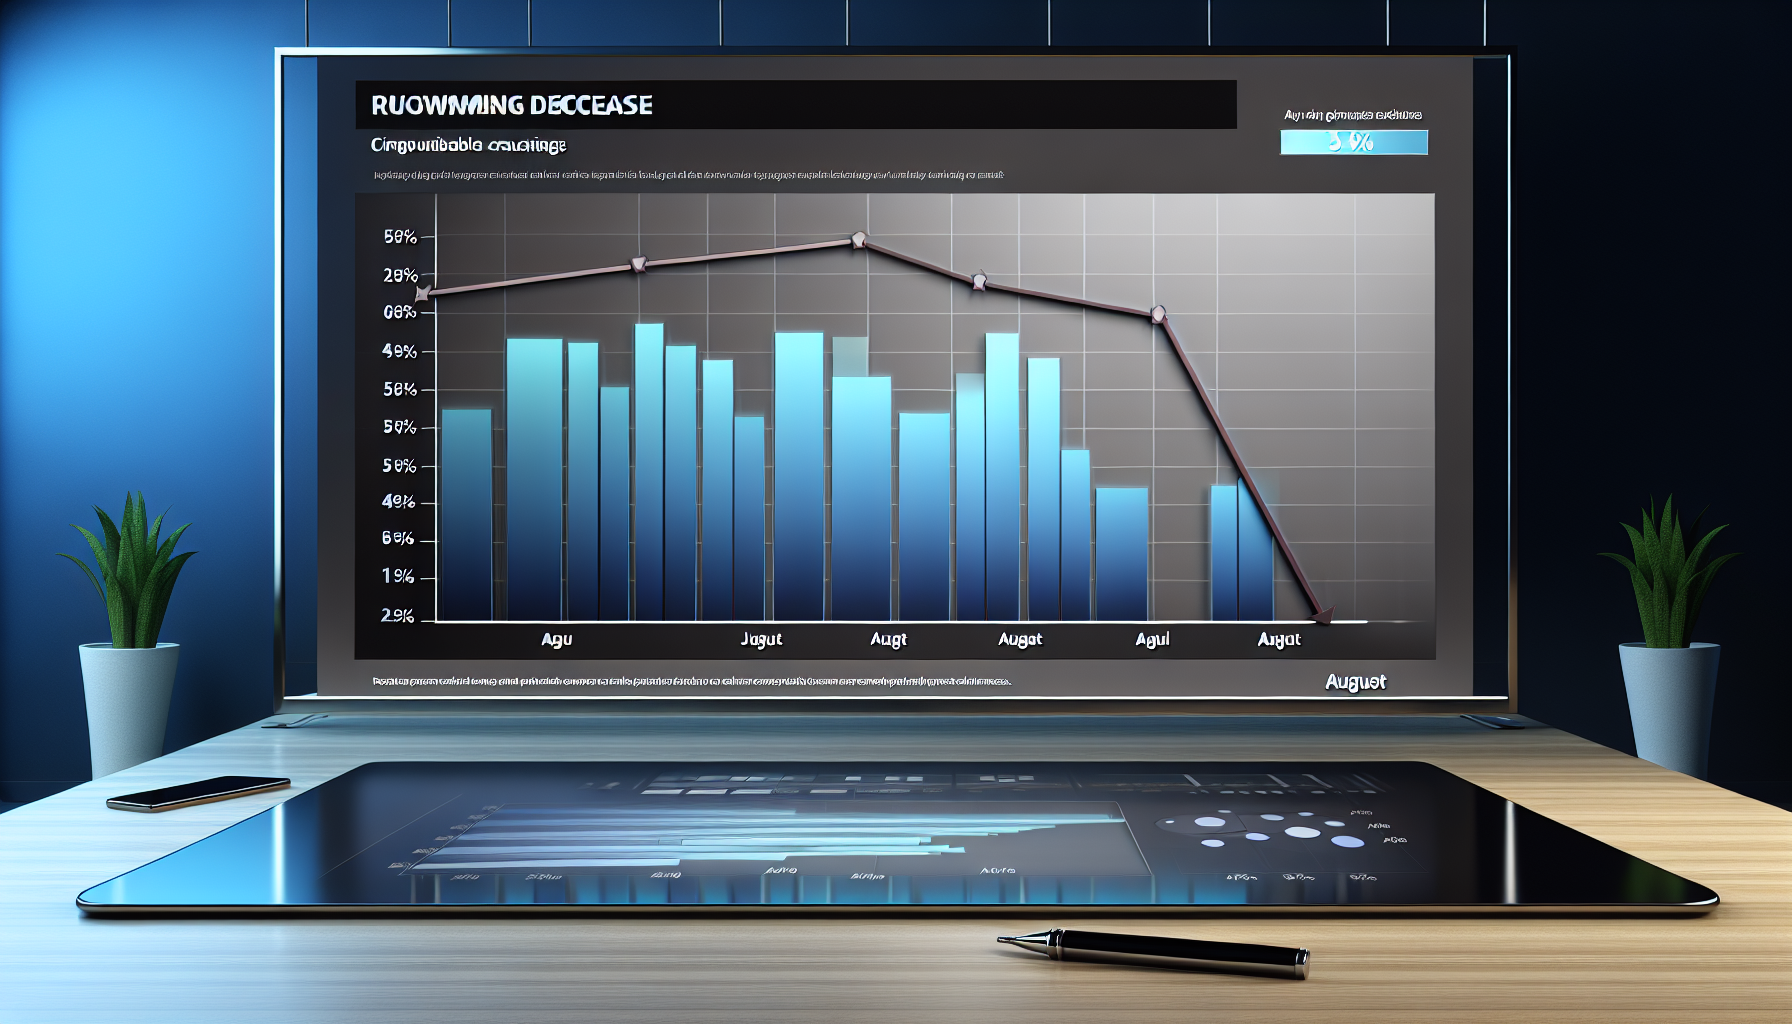
Twitch viewership fell to its lowest monthly level in five years in August 2025, as total watch time dropped 9% from July and peak concurrent viewers collapsed 73% from an event-inflated base, according to new platform-wide statistics published September 1 by StreamCharts [1]. The pullback followed Twitch’s July 28 rollout of improved viewbot detection, which the company warned would visibly reduce counts on affected channels and ultimately touched thousands of streamers [2].
Key Takeaways
– Shows August 2025 delivered Twitch’s weakest month in five years, with platform watch time down 9% compared with July, per StreamCharts’ monthly analysis.
– Reveals peak concurrent viewership plunged 73% from July’s La Velada spike, reflecting both event normalization and immediate impacts from bot filtering.
– Demonstrates sitewide viewership declines of 5–22% by hour after the July 28 detection update, with creators publicly reporting sudden drops in counts.
– Indicates more than 41,000 channels averaging 50+ viewers were flagged suspicious, while top creators saw estimated 20–30% losses in visible viewers.
– Suggests advertiser trust and discoverability were distorted by inflated metrics; stricter anti-bot enforcement could reset baselines after reported 5–22% declines.
Why Twitch viewership hit a five-year low in August
StreamCharts’ monthly report concluded August was Twitch’s weakest month since 2020, driven by a 9% month-over-month decrease in watch time and a sharp comedown from July’s outsized peaks tied to Ibai’s La Velada event [1]. Crucially, the analysts attributed a major share of the visible decline to Twitch’s viewbot-detection rollout, which began impacting counts immediately after July 28 [1].
The 73% plunge in peak concurrent viewership is partly a base effect: July’s marquee event temporarily inflated peak counts, then normalized as the calendar rolled over [1]. Even with that context, the combination of dissipating event traffic and stricter filtering produced the platform’s worst monthly aggregate since the pandemic-era highs, setting a new baseline for Twitch viewership heading into the fall [1].
AInvest, summarizing the StreamCharts dataset, reinforced the dual explanation: the crackdown materially reshaped public-facing metrics in August, while competitive pressures and stretches of inactivity among top streamers also weighed on platform totals [4]. With fewer tentpole broadcasts and a recalibrated measurement system, August’s lows reflect both weaker programming windows and a systemic purge of non-human traffic from viewership figures [4].
How the viewbot crackdown reshaped Twitch viewership metrics
Twitch warned creators on July 28 that “you will see an impact to your channel’s viewcount,” as it improved bot-detection systems and said it aimed to avoid filtering real users, according to CEO Dan Clancy’s comments reported by the Daily Dot [2]. The outlet noted thousands of channels were affected, sparking debate about whether the drops were primarily enforcement-driven, event-driven, or both [2].
Independent trackers and industry analysts observed immediate, measurable effects. Sports Illustrated cited analyst Zach Bussey’s estimate that post-update sitewide counts fell between 5% and 22% depending on the hour, underscoring how much automation had been inflating audience numbers across time zones and content categories [3]. Streamers reported visible dips, with some alleging agencies and promotion shops had used bots to game discovery and sponsorships before the filter updates [3].
The scale of suspected inauthentic activity was striking. MoneyControl reported that product manager Nazar Babenko flagged more than 41,000 channels averaging over 50 viewers as suspicious during the crackdown window, highlighting the breadth of potential exposure across mid-size creators [5]. The same report referenced top creators seeing 20–30% declines, a level that would materially alter revenue expectations tied to ads and sponsorships [5].
Twitch’s message emphasized precision—removing bots without misclassifying real users—but any broad detection sweep risks edge cases where legitimate viewers are discounted or delayed [2]. Nevertheless, the statistical pattern of 5–22% sitewide declines, coupled with tens of thousands of suspicious channels, points to a structural reset in the way Twitch viewership will be counted and marketed going forward [3][5].
Peak vs. watch time: parsing the 73% plunge
Peak concurrent viewership is volatile, often hinging on singular tentpoles. July’s La Velada supercharged peaks, so August’s 73% drop reflects both event normalization and the removal of artificial inflation from bots, making “peak” a noisy indicator of sustained audience health in this period [1]. Watch time, by contrast, declined 9% month over month—a smaller, steadier signal that still marks a notable setback [1].
By separating event effects from enforcement effects, a clearer picture emerges. AInvest’s synthesis of StreamCharts’ data argues that the crackdown substantially reshaped the visible ceiling of Twitch audiences at any given moment, while the watch-time dip captures a broader, but less dramatic, softening in engagement during a quieter programming month [4]. In practice, advertisers and analysts should treat August peaks as a break in time series rather than a comparable point to pre-crackdown highs [4].
The implication for benchmarks is straightforward: future peak comparisons should be anchored to August and September post-enforcement baselines, while watch-time trends remain more appropriate for gauging underlying audience retention amid ongoing measurement changes [1][4].
Twitch viewership and advertiser trust: who wins, who loses
Inflated metrics carry real costs. Sports Illustrated reported concerns that bot-driven inflation distorted discoverability for small creators and undermined advertiser trust, eroding the integrity of the ad ecosystem that funds much of the platform’s revenue [3]. When numbers fall 5–22% overnight after a detection update, buyers reassess the reliability of pre-crackdown KPIs and the performance guarantees in creator and agency decks [3].
Yet a tougher stance can restore confidence. By identifying over 41,000 suspicious channels and compressing top-creator counts by 20–30% where bots had padded reach, Twitch can begin to reestablish a credible baseline for cost-per-thousand (CPM) and sponsorship valuations tied to authentic audiences [5]. Cleaner numbers may reduce short-term volumes but improve long-term inventory quality and brand safety narratives [5].
The Daily Dot’s reporting shows Twitch leadership framed the update around accuracy—removing bots without harming real users—suggesting this is not a one-off sweep but part of an iterative detection roadmap [2]. Over time, consistent enforcement should narrow the gap between reported and real engagement, even if that means a leaner headline figure for Twitch viewership in the near term [2].
What’s behind the five-year low in Twitch viewership—and what’s next
The August nadir blends structural and cyclical drivers: stricter bot filtering, fewer tentpoles after La Velada, competition from rival platforms, and periods of inactivity among top streamers with outsized influence on platform totals [1][4]. StreamCharts’ callout of a five-year low—and a 9% watch-time decline—puts a number on the new reality as the platform transitions to post-crackdown measurement [1].
In the near term, analysts will watch whether September stabilizes around the August baseline, or whether additional detection waves produce further 5–22% swings by hour or creator segment [3]. Marketers will also track whether the 20–30% drops reported among top channels persist, or rebound as real audiences re-accumulate and programming ramps up after summer [5].
For all stakeholders, the guidance is to rebench. Compare peaks to August onward, assess watch-time moving averages for trend direction, and weight third-party verification more heavily in campaign planning until detection methods and creator behaviors settle into a new equilibrium [1][4].
How the viewbot crackdown reshaped Twitch viewership metrics
Twitch’s July 28 announcement explicitly told creators to expect visible impacts, and reporting confirmed thousands of channels experienced immediate drops as detection rolled out across the network [2]. Aggregators and analysts quantified the change at 5–22% sitewide declines depending on hour, reflecting how bot patterns vary across geographies and content verticals [3]. The breadth—over 41,000 suspicious channels averaging 50+ viewers—signals a systemic shift that will define how Twitch viewership is measured into Q4 2025 [5].
Sources:
[1] StreamCharts – Twitch records worst monthly stats in five years: https://streamscharts.com/news/twitch-records-worst-monthly-stats-five-years
[2] Daily Dot – Twitch CEO says company is taking action against viewbotters: https://www.dailydot.com/news/twitch-viewbotters/
[3] Sports Illustrated – Is Everyone Viewbotting? Top Streamers See Huge Viewership Loss in New Twitch Update: https://www.si.com/esports/news/twitch-viewbotting-crisis
[4] AInvest – Twitch Viewership Plummets 73% Amid Viewbotting Crackdown and Competitive Streaming Landscape: https://www.ainvest.com/news/twitch-viewership-plummets-73-viewbotting-crackdown-competitive-streaming-landscape-2509/
[5] MoneyControl – Twitch viewership drops sharply after crackdown on viewbotting: https://www.moneycontrol.com/technology/twitch-viewership-drops-sharply-after-crackdown-on-viewbotting-article-13491314.html
Image generated by DALL-E 3


Leave a Reply